The St. Louis Fed published a new study on Economic Mobility in the US. The study leads to a simple statistic: “the probability that a child born to parents in the bottom fifth of the income distribution makes the leap all the way to the top fifth of the income distribution”
Children born to parents in the bottom fifth of the income distribution chance of reaching the top fifth:
- 7.5% USA
- 9.0% UK
- 11.7% Denmark
-
13.5% Canada
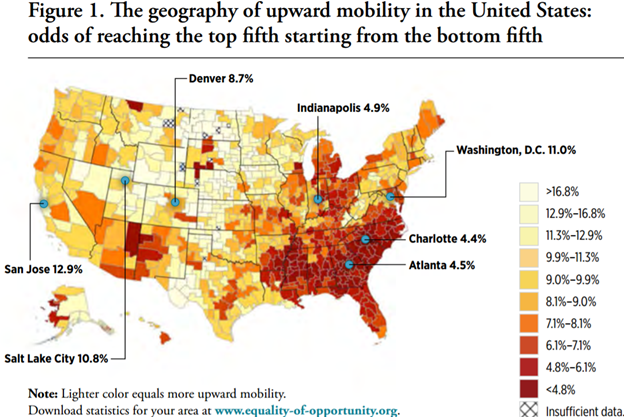
There is a high degree of variation between regions in the US. The most optimistic and pessimistic numbers are:
- 16.8% Top decile USA
- 4.8% Bottom decile USA
People growing up in San Jose, California are three times as likely to move up the income ladder compared to Charlotte, Atlanta, Indianapolis.
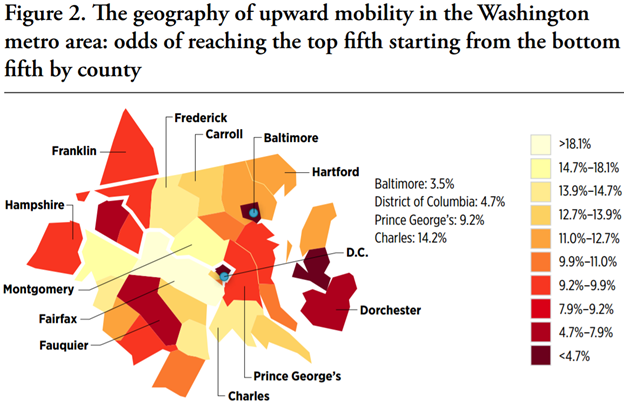
The high degree of variation is not only regional. It is visible at the county level.
Average upward mobility rate:
- 11% DC Metro Average
- 3.5% Baltimore
- 4.7% DC
- 9.2% Prince Georges County
- 14.2% Charles County
Factors affecting mobility during childhood in the more mobile areas include:
- moving to low poverty census tracts improves long-term success
- moving to a mobile area increases earnings in adulthood by 30%
- higher likelihood of attending college
- lower instances of teen pregnancy
General factors contributing to upward mobility:
- mixed income communities produce a better outcome for kids from disadvantaged backgrounds
- areas with less income inequality have higher rates of upward mobility
- areas with fewer single parents have substantially higher rates of upward mobility
- areas that are more socially cohesive have higher rates of social mobility
Risk assessments are important for international and local ventures. Finding a high-performing economy and a suitable workforce lowers the risk of failure. This information from the St. Louis Fed is an essential source for performing a risk assessment for US domestic businesses and for foreign businesses seeking to enter the US market.